Your costs are
logged. Now make
them legible.
Share reports with clients, reconcile against provider invoices, and track spend across your whole team, from a hosted dashboard you don't have to run.
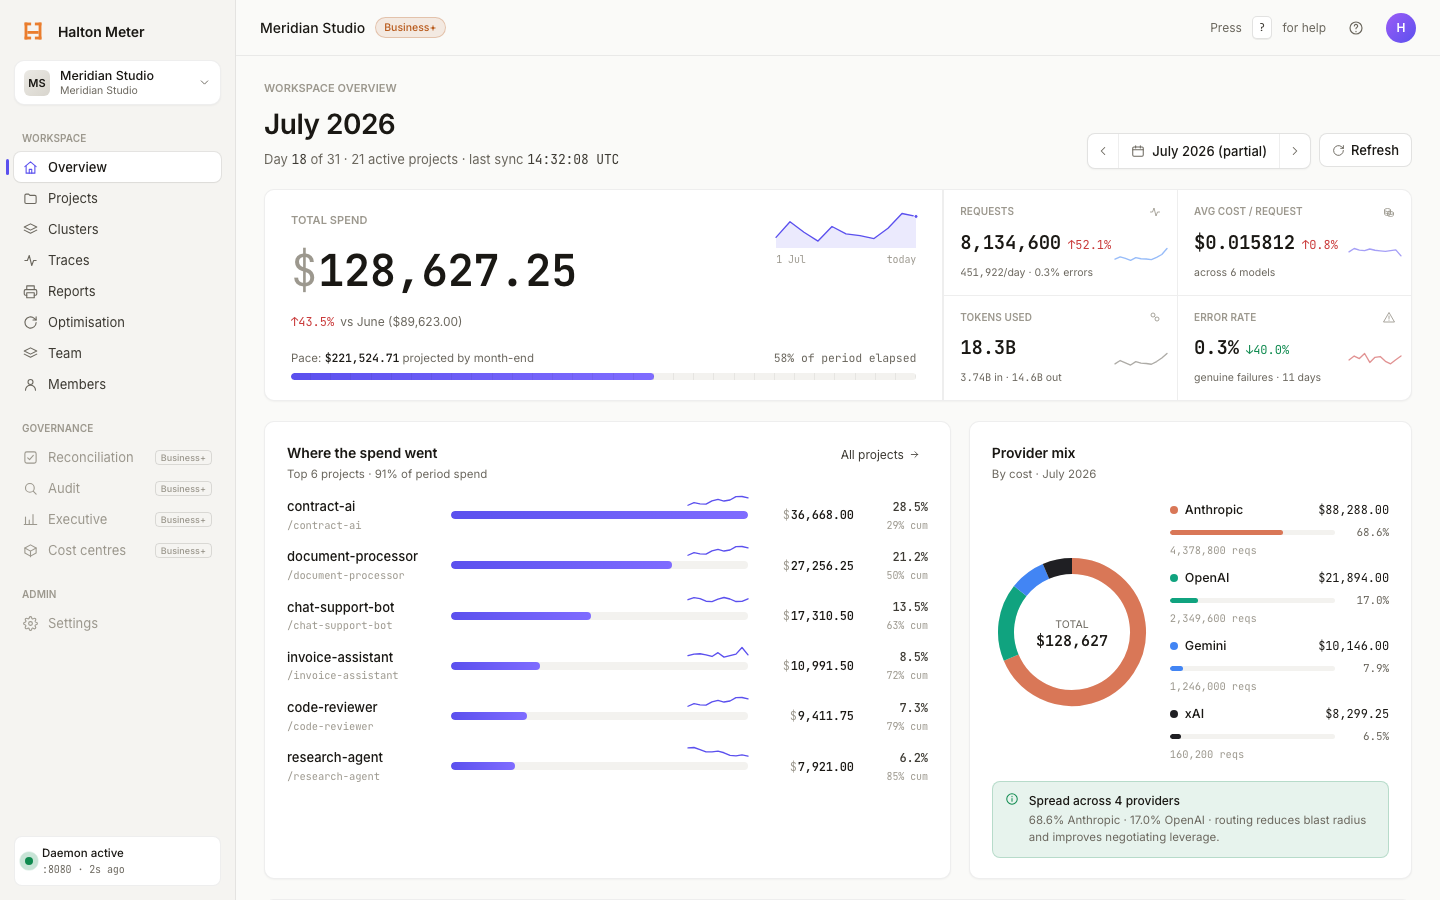
01 · Instruments · sample workspace
LLM cost attribution,
laid out for a quarterly review.
Charts like these are drawn straight from your log ledger — spend by project, daily rhythm, provider mix, reconciliation deltas. The same numbers your daemon prints, structured so finance can read them without a terminal.
Instrument 01
Per-project LLM cost.
Every request is tagged with a project slug at capture time. The daemon infers attribution automatically from the working directory. No manual labelling required.
Daily API spend · July 2026 (1–15 Jul)
Instrument 02
Daily cost rhythm.
Spend doesn't arrive uniformly. Spikes signal batch runs, test cycles, or new agents being evaluated. The daily chart surfaces those rhythms so you can correlate cost with delivery milestones before the invoice arrives.
The daemon buffers locally and flushes to the cloud API every 60 seconds. These numbers are never more than a minute behind reality.
Instrument 03
How it lines up with the provider invoice.
The numbers your daemon computes from your LLM API calls: token cost tracking reconciled against the totals each provider charges you at month-end. Targeted variance is <1%. Anything over and the workspace flags it for review.
Every figure traces to a rate table you can inspect — the same one reconciliation uses. Full month-by-month reconciliation available on Business+.
Sonnet 5, GPT-5.6, and Grok 4.5 were priced within days of launch. New models never show up as $0.00.
Display spend in your team's currency — daily ECB-backed rates, and the rate used is recorded on every converted figure.
PROVIDER MIX · COST SHARE
What's running
ADVISORY · WORKSPACE: MERIDIAN-STUDIO
chat-support-bot
71% of requests run Opus 4.7 on prompts under 400 tokens.
Simulated on Haiku 4.5: −$18.40/mo at current volume.
Instrument 04
The meter that finds the savings.
Twelve optimization rules read your live traffic. Each advisory simulates the cheaper counterfactual, then tracks realised savings for 14 days after you act. Anomalies and forecasts surface before the invoice does.
Included at every tier — optimization advisories, anomalies, and forecasts ship on Solo, Team, and Business+.
Your latency is your
provider's latency.
Halton Meter is a local pass-through, not a gateway. Your request goes straight to Anthropic (Claude), OpenAI, Google Gemini, and xAI (Grok). The meter reads it on the way past and computes cost from what it sees. There's no remote hop on your critical path, and nothing about how you call the model changes. If the daemon stops, your traffic falls straight through to the provider, untouched.
- Runs on your machine. The proxy is local. Your call reaches the provider directly. It is not routed through Halton Labs infrastructure and back, so there is no remote hop to add.
- Fail-open by design. If the daemon crashes or is shut off, requests pass through to the provider exactly as before. Observation is never a single point of failure for your work.
- No SDK wrapper. We don’t intercept your client library or inject middleware. Claude Code, the Anthropic SDK, and everything else keep working unchanged.
Most cost tools sit in your request path. We sit beside it.
One click. PDF a client
would actually read.
Reports pull from your live ledger. No re-keying. Personal summaries for retros. Client invoices for billable AI work. Executive P&L for the leadership team. Generated, downloaded, shared with link expiry.

| Model | Reqs | USD |
|---|---|---|
| Opus 4.7 | 620 | $118.30 |
| Sonnet 4.6 | 2,840 | $52.15 |
| Haiku 4.5 | 1,905 | $12.10 |
| GPT-5.5 Pro | 780 | $57.10 |
| Gemini Flash | 480 | $30.51 |
| Grok 4 | 110 | $9.72 |
QUICK TEMPLATES
Record and Warn never touch the request path. Block stops the call locally.
Policies are defined in Cloud and enforced where they must be. Record, the default, detects, attributes, and logs. Warn alerts from Cloud and never touches the daemon. Block is enforced locally by the daemon, fail-safe, with no Cloud round-trip. If Cloud is unreachable, the block still applies. Record and Warn are broadly available; hard Block enforcement is Business+, opt-in per workspace.
- Workspace spend capWARN
- Per-model capWARN
- Token-rate limitWARN
- Model restrictionsWARN
Alert, never block.
Cloud emails the workspace owner and raises an in-app alert. The proxy is never touched. Traffic flows exactly as before.
Recent alerts
- contract-ai exceeded its $25 budget → #ai-spend (Slack) 3d ago
- Opus rate spike · 2.4M tok/min 5d ago
- Grok call · off allow-list 6d ago
Budget breaches land in the right Slack channel — scoped per workspace or org. Email is the default; Slack channels are the additional sink.
One proxy.
Three altitudes.
The same local daemon feeds every tier. You climb from a single developer's cost view to a multi-workspace estate without changing a line of how you call the model.
Solo
One developer. The full cost view.
- Overview KPIs, daily spend, Pareto
- Projects detail, model split, CSV
- Optimization advisories
- Reports personal + client invoice
- Settings keys, currency, rates
Team
Adds collaboration across one shared workspace.
Everything in Solo, plus
- Traces full request receipts
- Teams budgets, rosters, activity
- Members per-person spend
- Machines live sync health — active, stale, offline at a glance
- Alerts budget breaches land in the right Slack channel
- Clusters client invoicing, margin at a glance
- Reports executive summary PDF
Business+
Enterprise governance, finance-grade controls, and the multi-workspace estate.
Everything in Team, plus
- Executive cockpit · board pack
- Reconciliation vs provider billing
- Cost centres GL mapping + chargeback
- Audit log hash-chained, SIEM export
- Policy engine hard Block enforcement · Record / Warn broadly available
- Org HQ multi-workspace estate rollup
- People RBAC personas, SCIM, SSO
06 · Pricing · open daemon, hosted Cloud
Daemon stays free.
Cloud makes it legible.
The daemon stays free. Cloud adds hosted persistence, team access, PDF reports, and provider reconciliation. Cancel any time; your daemon keeps working.
Not sure? Answer three questions.
Fits: Solo
Get Solo →Solo
per month · billed annually ($192/yr)
save 16% vs monthly
One developer. Full cost visibility across Anthropic (Claude), OpenAI, Google Gemini, and xAI (Grok). 1 seat.
What's included
- 1 seat · 2 machines · 7-day traces
- Overview
- Projects (list + detail)
- Reports workbench
- Reports: Personal summary
- Reports: Client invoice
- Optimisation (recommendations)
- Settings (account, workspace, API, billing)
Team
per month · 10 seats · billed annually ($1,188/yr)
Up to 10 seats. Need more? Business+.
One workspace for the whole team. Attribution down to the individual; reports up to the client. 10 seats included.
What's included
- Up to 10 seats · 3 machines per user · 30-day traces
- Everything in Solo
- Clusters
- Team page
- Members page
- Traces (individual trace detail)
- Reports: Executive (PDF export)
Business+
annual · invoiced
Unlimited seats and the full governance layer: provider reconciliation, audit, cost allocation, model policies, SSO, and a multi-workspace estate. Scoped and priced to your org.
What's included
- Everything in Team
- Reconciliation & cost
- Month-by-month reconciliation against provider invoices
- Cost centres + chargeback allocation
- Executive P&L dashboard
- Governance & audit
- Append-only audit log, with SIEM export
- Model policies: Record / Warn / Block. Hard Block enforced locally by the daemon, fail-safe
- Your negotiated provider rates — reports show contracted cost, not list price
- Identity & estate
- SSO: SAML 2.0 with SCIM provisioning
- Org HQ: multi-workspace estate
- Custom roles — down to who may run the daemon
- Per-developer budgets (warn-only)
Daemon
The daemon runs standalone: local-first LLM observability, no Cloud account required.
$ curl -fsSL https://get.haltonmeter.com/install.sh | sh $ uvx halton-meter Every plan works with the free daemon. Your data is yours; export anytime.
FAQs →07 · Enterprise · self-hosted Cloud
When the data can't leave
the building.
Some workloads come with data-residency requirements that no public SaaS can satisfy. Halton Meter ships as a self-hosted distribution: the same backend and dashboard, running in your VPC under your keys, with no traffic routed through Halton Labs infrastructure.
- Data residency Your VPC, your keys
Deploy via Helm chart or Terraform module. Postgres, the API server, and the dashboard all run inside your perimeter. No outbound data. No shared tenant infrastructure.
- Identity SAML, SCIM, audit log
Connect Okta, Azure AD, or JumpCloud via SAML 2.0. Provision and deprovision teams automatically via SCIM. Every login, export, and policy change lands in an append-only audit log.
- Support Dedicated channel, SLA
Shared Slack channel with direct access to the engineering team. 99.9% uptime SLA on the hosted components. Annual security review with findings report.
Architecture · self-hosted deployment
08 · Questions
Frequently asked.
The daemon is required. It's the local proxy that captures requests on the developer's machine. Cloud is a hosted home for that data. The daemon stays free and runs entirely on your laptop; Cloud is the sync target.
Metadata only: model, token counts, computed cost, project tag, and timestamp. Prompts and responses never leave your machine unless you flip the separate store_prompt_content opt-in, which is off by default.
Provider dashboards show you what you spent on that provider. Halton Meter shows you what you spent across every provider, attributed to the project, member, or client that incurred it, and reconciles those totals against the provider invoice so you can spot drift.
You get a full CSV export of your data. After cancellation, your data is available to download for 30 days. After that, it is deleted. We do not hold it as leverage.
Anthropic (Claude), OpenAI, Google Gemini, and xAI (Grok) ship first-class adapters today. Those four families are the providers the daemon meters. Anything outside the four metered families passes through unmetered, fail-open. Talk to us about additional providers.
On a schedule (default nightly), Cloud pulls billed totals from the provider's billing API — Anthropic and OpenAI today, with a usage-CSV path for the rest — and diffs them against the daemon's readings. Keys are write-only and KMS-encrypted. Variance under 1% is a tick; over 1% gets flagged for review with a per-day breakdown. Reconciliation is a Business+ feature.
No. The daemon is a transparent local proxy. Your tools keep working exactly as they do now. If the daemon stops, traffic falls through to your providers. Nothing breaks.
We reconcile logged totals against your provider billing statements. In practice the largest variance we have logged is $0.84 on a $279.88 month — about 0.30%. The reconciliation methodology is documented at docs.haltonmeter.com.
Pricing is in USD. Provider invoices reconcile in each provider's billing currency.
From Settings → Billing → Cancel plan. Cancellation takes effect at the end of your current billing period. No cancellation fee. Your data export is available immediately.
Your request path doesn't change. The daemon is a local pass-through — the call goes straight to the provider; no remote gateway hop, no SDK wrapper. The meter reads the traffic as it passes to compute cost. If the daemon stops for any reason, traffic falls through to the provider untouched, so your tools never block on us.
A gateway sits in front of your traffic and routes every call through its own infrastructure — which adds a network hop and makes it a dependency for your requests to work at all. Halton Meter observes locally instead: it watches the traffic your machine already sends and never becomes a required link in the chain. You get the cost data without taking on a new point of failure.
One line. On macOS or Linux, run curl -fsSL https://get.haltonmeter.com/install.sh | sh. On Windows PowerShell, run irm https://get.haltonmeter.com/install.ps1 | iex. It's a fail-open bootstrap that puts the daemon in place. macOS is GA; Linux and Windows are first-class but in public beta. If you prefer the Python-tool workflow, the uvx, uv tool, and pipx instructions still work exactly as before — the one-liner sits alongside them, it doesn't replace them.
Solo: 1 seat, 2 paired machines, 7 days of trace history. Team: up to 10 seats, 3 machines per user, 30 days of traces. Business+ removes the seat cap and adds the governance layer; it is scoped per org. Every tier can read the pricing-rate table its costs are computed from.
Three postures. Record, the default, detects, attributes, and logs every call with no alerts and no interruption. Warn emails the workspace owner and raises an in-app alert while the request path flows untouched. Block stops the call locally before it reaches the provider — fail-safe, no Cloud round-trip, and it still applies if Cloud is unreachable. Hard Block is a Business+ capability, off until a workspace opts in via the allow-hard-block flag, and you can dry-run which recent calls would be blocked before you enable it. Record and Warn are broadly available. Policies are not the same as budgets: budgets are warn-only and never block; only the policy engine can stop a call.
09 · The handshake
Pair your daemon.
Watch the readings populate.
The daemon keeps your readings. Cloud makes them legible to everyone else.
- Paste one code. halton-meter cloud connect prints XXXX-XXXX
- Approve in the browser. enter the code on the /connect screen, one click
- The first captured request appears. with its cost, attributed to its project
curl -fsSL https://get.haltonmeter.com/install.sh | sh
Windows · irm https://get.haltonmeter.com/install.ps1 | iex
or uvx halton-meter && halton-meter init
bg: Halton(2,3) — the sequence we're named for.